If we have been successful in moving the application development process to the logical or business level, what then does debugging look like. Errors surely will be made, not maybe the common programming errors of today, but surely rules will be misstated and work flow algorithms will go amiss. Much of this will be debugged through an evaluation of the various interface data, but the actual error made is often considerably removed from the symptom that reveals itself to the end user. AOA addresses much of these problems through the introduction of an Object Browser, a tool which provides a visual representation of the object data which is the foundation for the data shown on interfaces.
In the Components sections of this presentation, it was noted that the problems of query rested on the same logical business issues as the problem of design, namely, understanding the structure of data. This enabled both components to use the same structure of data definition, the LOD (or AOA Object definition). The same principle holds true in debugging: because the same logical structure of data is used at execution time as at design time, execution-time object data can be evaluated through very similar visual interfaces as those used in design. Thus the Object Browser presents object data through a tree structure, very much like that used in the LOD tool.
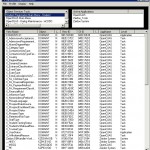
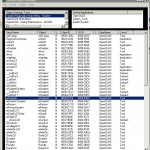
During execution of an AOA application, object instances begin to accrue in memory and are listed in the first window of the Browser. The first two diagrams to the right show the objects currently in memory while running basic functionality for the Registrar module. Some particular points to note are:
1. In the first diagram, there are a large number of “views’ into the DOMAINT object. This is shown by their having the same “OI ID” (Object Instance ID), but a different “View ID”. The different views allow different positions to be kept into the same object.
2. In the second diagram, the mStudenC object exists only once in memory, with a single view, but two different names. That there is only one object and view is shown by the two entries having the same OI ID and View ID. In complex work flow, it is common to have multiple names for the same object or view. In that diagram, the mStudenC object view is highlighted. The mstudenC, mStudent and mPerson objects make up the student data used on the several tabs of the Registrar interface for a student.
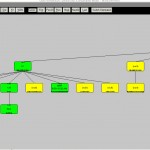
3. The third diagram shows part of the structure of an instance of an mStudenC object. Note that the Register entity is highlighted in red and that the values of its attributes are shown in the list on the left side of the window.
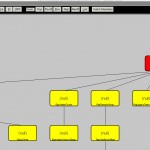
4. The next diagram shows an enlargement of the Register entity (i.e., zoomed in version) so that the position within that entity is more clearly displayed. Note that we are positioned on the 46th of 48 entities within its parent.
Debugging in AOA is largely the process of stopping at various points during rules or work flow processing and examining the current object content using the Object Browser.


